In the final installment of our Duke case study, we will go over how a single game can be analyzed and visualized. Similar to the first and second posts, lineups and player combinations, and their respective offensive and defensive ratings, will be the primary lens through which we will perform our analysis, but we will include a brief four factors comparison as well. All of the analysis will be based on our publicly available Duke demo dataset. Of note, the public version of this data only includes the Duke side of every game. Additionally, this review is meant to demonstrate how Pivot's basketball software can be used to enhance one's understand and analysis of a match; it is not a replacement of traditional game and film analysis.
The End of the Road for the Duke Blue Devils

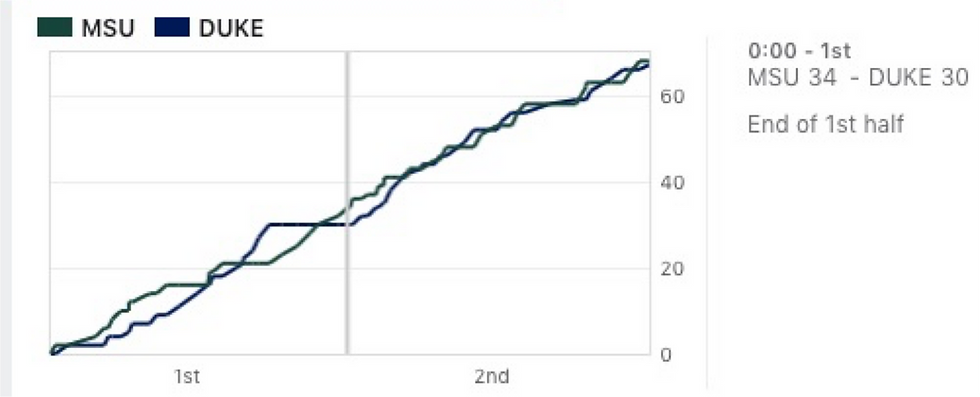
The top-seeded Duke Blue Devils were knocked out of the 2019 NCAA Tournament in the Elite Eight by Tom Izzo's Michigan State Spartans. Duke was a heavy favorite in this matchup and the overall favorite to take home the title. But, in a single elimination tournament, anything can happen. As the run charts below demonstrate, this match was always close and neither team ever held much of an advantage.

Understanding Lineup and Substitution Impacts
I have included our lineup-based run chart as a comparison point to the standard point-by-point run chart. By looking at how the teams perform between substitutions (or by lineup), we can smooth out some of the ups and downs and identify which rotations were actually "winning" or "losing" lineups.

The broad strokes of the match are the same, but in the Pivot game view, you can see that once Duke lost the lead at the end of the 1st half and no rotation was able to regain it.
Both charts show that the game was won/lost at the end of the 1st half though. Duke built a small lead and then not only lost the lead but fell behind by four. Also, using the Pivot view, we know that two substitution were made at the end of the 1st half, and that it was these two sub events that cost them. Using the game view as well as the lineup analysis tool, we can review the substitutions and lineup performance.
At 4:52, in the midst of a 12-0 run, Coach K pulled out Zion Williamson. Immediately, MSU went on a run. Despite putting Zion back in, the momentum had shifted and MSU closed out the half on a 13-0 run. It was this shift in momentum that swung the odds of winning from in Duke's favor to MSU's.

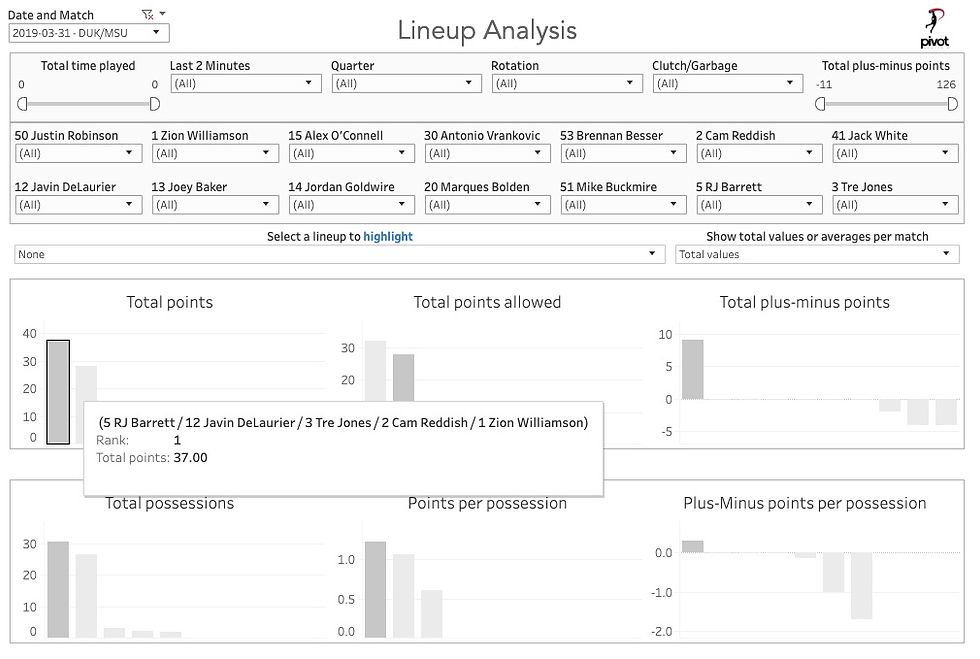
Reviewing the overall lineup data provides a clearer picture at the positive and negative lineups as well as the overall plus minus. Lineups with Zion were +5 in 37 minutes. In the 3 minutes without Zion, those lineups were -6. In a game where RJ Barrett and Tre Jones played the full 40, Zion's three minutes of rest cost Duke the game.

Duke Blue Devils' Four Factors Analysis
A four factors review paints a similar picture. This is a game that Duke could have and should have won. It is not common to win three of the four factors and lose the game. But the turnover disparity was so great that, despite winning the other factors, Duke was unable to overcome the fact that MSU attempted 13 more field goals.

Thank you for following along as we used the Pivot Analysis tools to review some aspects of the 2018-2019 Duke Basketball season. As the feature are added to the product, we will continue spotlight them here in our blog and we will always use real-world scenarios to demonstrate how these tools and statistics can provide meaningful insights and actionable intelligence to our basketball-loving community!
Comentários